0
Table of Contents
UI/UX design services guide for founders: what actually improves revenue?
It's easy to spend design money in the wrong place. Start with the fixes you can measure.
When you're looking for design work that can improve revenue, start with the path between a stranger's first click and their first moment of real value. A visitor has to understand the offer and get through sign-up and onboarding, and slow pages and screens that generate avoidable support tickets can interrupt that path too.
The visual refresh, the illustration set, and the motion work (the parts of UI/UX design services that look best) can be worth doing as well. Their priority depends on what's holding your users back. Today, however, we are talking about revenue improvement.
If you're the founder or product owner deciding what to fix first, what it should cost, and whether to hire outside help, tie that decision to a measurable problem. To work out your UI/UX design ROI, you'll need the full cost of fixing it and a reasonable way to check what changed.
We're Merge, a UI/UX design agency working with B2B SaaS and fintech teams, so we have opinions. If you've read our UX audit breakdown or our SaaS user onboarding teardown, this is the continuation.
What are UI/UX design services?
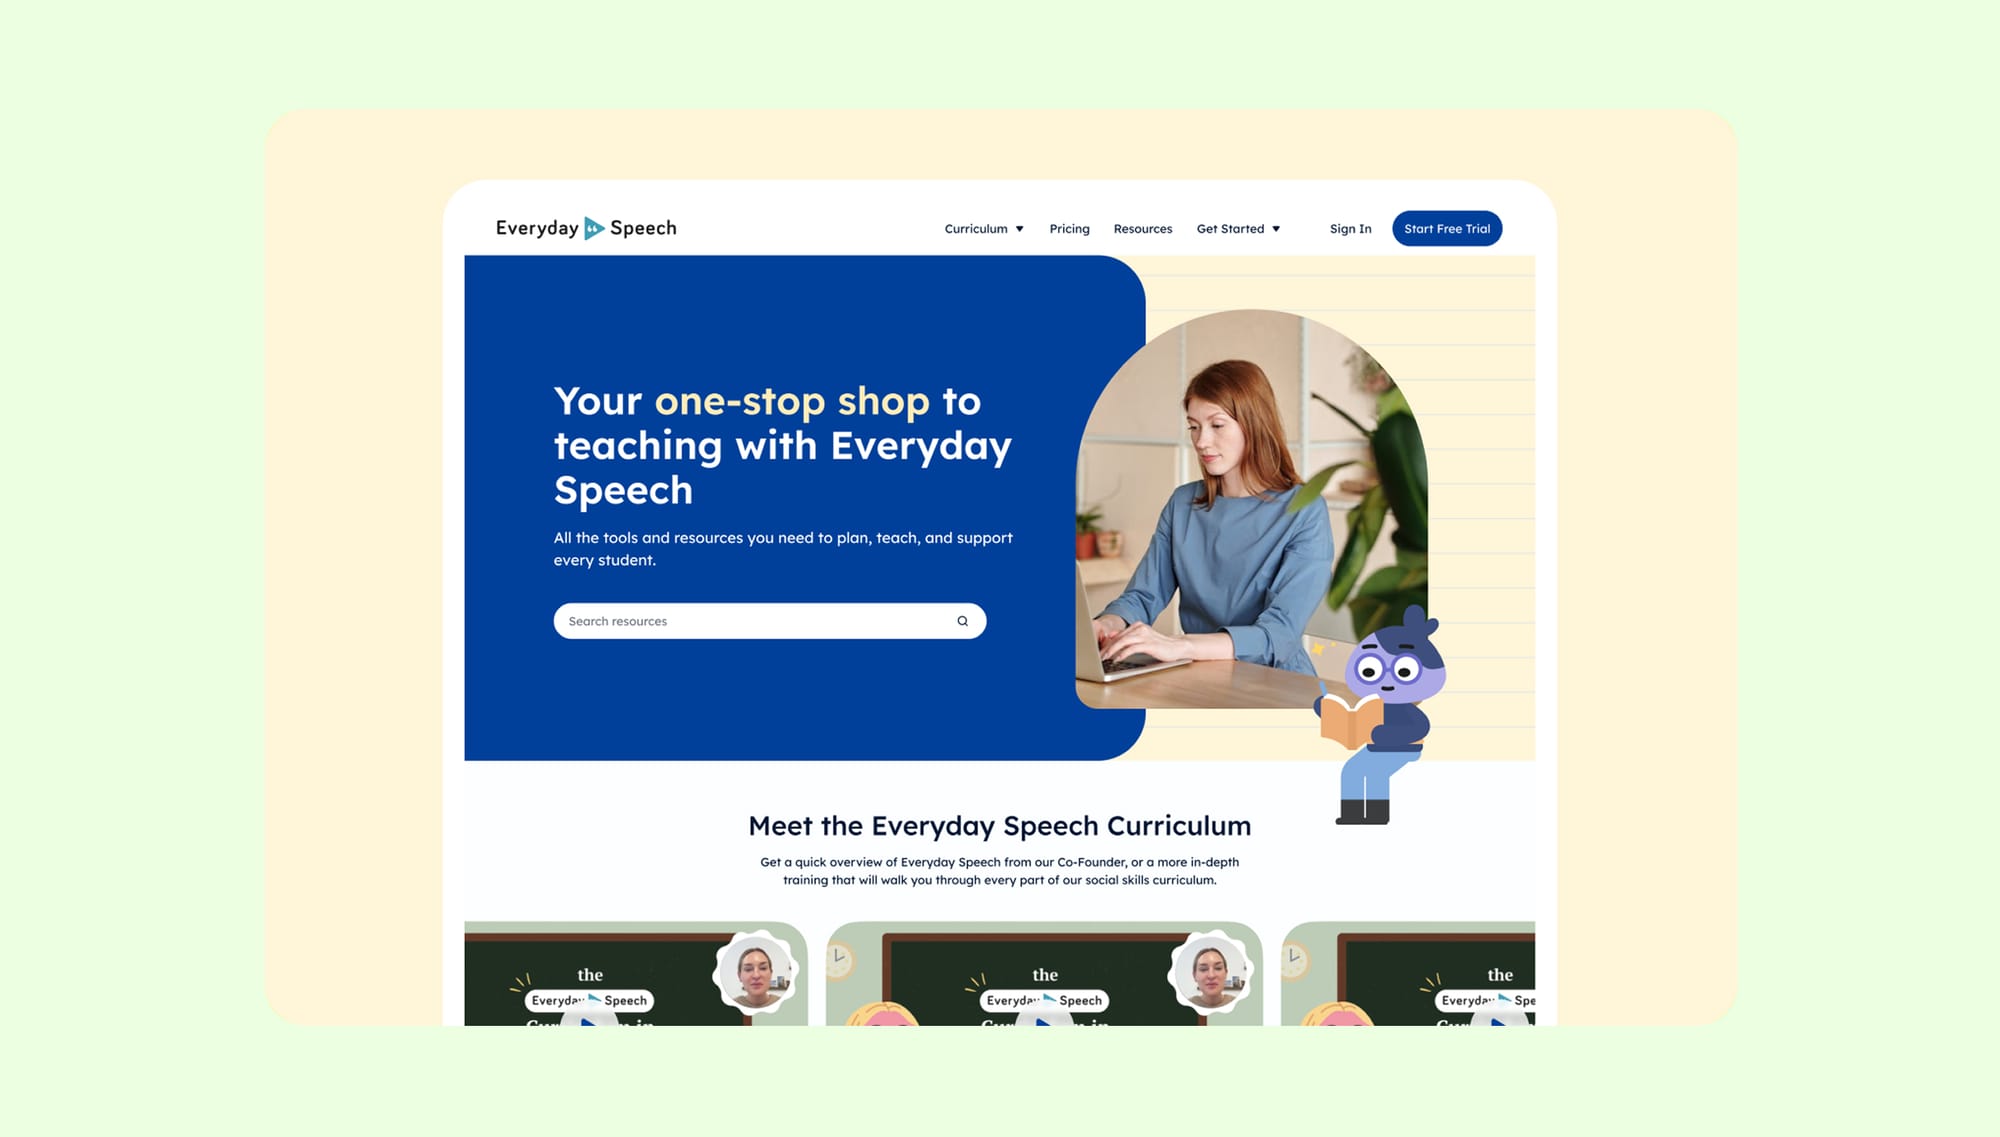
UI/UX design services are all the research, design, and testing work that shapes how your product and website behave and how they look. UX (user experience) is the plumbing: flows, structure, and the steps between landing on your site and paying you. UI (user interface) is the surface: layout, type, color, states, motion.
When development is included, you're buying design plus implementation from one team instead of two. That mostly matters for handoff, so check how the two will work together and what's actually included: coding doesn't come automatically with interface design.
Depending on what you need, an engagement can include some mix of:
- Research and audit. Watching real users, reading your analytics, and listing what's broken in order of its likely cost to the business. User research is a separate scope to discuss when the underlying problem still needs investigation.
- Information architecture and user flows. Deciding what lives where and how many steps each job takes. Usually fewer than you have now.
- Interface design. Screens, components, states, and, where needed, a design system that stops them from drifting apart as you grow.
- Usability testing. Checking that a real human can finish the task before you build it, not after.
- Ongoing design support. Your product keeps changing, so the design has to as well.
At Merge, UI/UX design for defined product flows has its own agreed scope. Research, audits, testing, a full design system, and development need separate confirmation.
So, which of these turns into money, how much, and how soon?
The design fixes that actually improve revenue
For starters, use these seven fixes. This isn't a measured ranking of payback speed – it’s your bottleneck and implementation costs that will decide which one goes first.
# | Design fix | Metric to watch | What the evidence says | What shapes the effort |
1 | Cut steps to first value | Activation, then retention | Userpilot's 2025 customer sample had a 10.1% median onboarding checklist completion rate; a checklist isn't activation | Setup dependencies, integrations, roles, and required verification |
2 | Strip friction from sign-up forms | Completed sign-ups | Baymard estimates 35.26% potential relative checkout conversion improvement for large ecommerce sites; this isn't a SaaS forecast | Required fields, validation, identity checks, and backend changes |
3 | Clarify the first screen | Qualified trial starts or demo requests | Test comprehension and the next action with your own visitors; checkout research doesn't measure hero copy | Positioning decisions, copy, proof, and page implementation |
4 | Speed up page load | LCP and downstream conversion | One Vodafone Italy A/B test reported 31% better LCP and 8% more sales | Assets, scripts, rendering, and engineering capacity |
5 | Design away your top support tickets | Repeat contacts, handling cost | Gartner's 2024 public abstract gives median costs per contact of $1.84 for self-service and $13.50 for assisted channels | Root causes, error recovery, help content, and instrumentation |
6 | Make design carry the room without you | Competitive win rate and sales objections | Hardest to measure, easiest to feel; track the decision rather than assuming a revenue lift | Product story, evidence, buying roles, and the sales cycle |
7 | Build a design system | Design and development cycle time | Figma's 2019 vendor study reported 34% faster completion of specific design tasks | Existing components, coverage, migration, and maintenance |
Sources and their limits are explained below. None of these external results are your target KPI, though.
Fix #1. Cut the steps between sign-up and first value
When people sign up but never reach the thing they signed up for, look closely at activation. In Userpilot's 2025 report, the mean activation rate was 37.5% across 62 B2B SaaS products in its customer sample. The checklist figures came from a separate sample of 188 products, with a median completion rate of 10.1%. A checklist you built yourself can still be a surprisingly effective place for users to get stuck.
What to do? First, define the one action that means a user got value, count the steps to it, and remove the ones that aren't needed yet. Pre-fill or defer the rest where you can. Completing a tour or creating an account only counts as activation if that actually represents value in your product.
On MO, a Shopify app we redesigned, the job was getting non-technical store owners to a live widget without reading documentation. Our case study reports average setup in under three minutes. It also reports conversion changes in two stores, from 0.64% to 1.61% and from 1.60% to 2.23% in the first month. We don't have a control or sample sizes in that report, so those results can't establish how much of the change the design caused or what it earned. Our user onboarding design page covers the work in more detail.
Once users get that first bit of value, follow the same group over time to see whether they come back, keep paying, or spend more. Check how activation connects to those results in your own data before putting a dollar value on an improvement.
Fix #2. Take the friction out of your forms
Some reasons people quit are quite fixable. In Baymard's US online-shopping survey, updated October 28, 2026, 40% cited high extra costs, 18% cited forced account creation, 19% didn't trust the site with their card details, and 17% cited a long or complicated checkout. These ecommerce findings exclude the “just browsing” segment, because respondents could select multiple reasons and these figures can overlap. You'd need your own data to know how often those problems occur in SaaS sign-up or fintech verification.
One funny detail shows how small the failures can be: in Baymard's checkout field research, 42% of test participants typed their full name into a “First Name” field at least once. With a single “Full Name” field, only 4% briefly hesitated before typing. Notice what's being measured: one figure records an entry mistake, the other hesitation, so this isn't a measured 42%-to-4% drop in the same error. Mind you, 89% of sites in that ecommerce benchmark still used multiple name fields.
Baymard also estimates 35.26% potential relative conversion improvement from fixing checkout usability on large ecommerce sites. That's a reason to inspect friction, not a percentage to put in your SaaS business case.
For fintech and B2B teams, look for fields or explanations that create avoidable work while keeping required identity checks in place. Explain why you need the information, then make it clear how to recover from an error without reentering details you can safely retain.
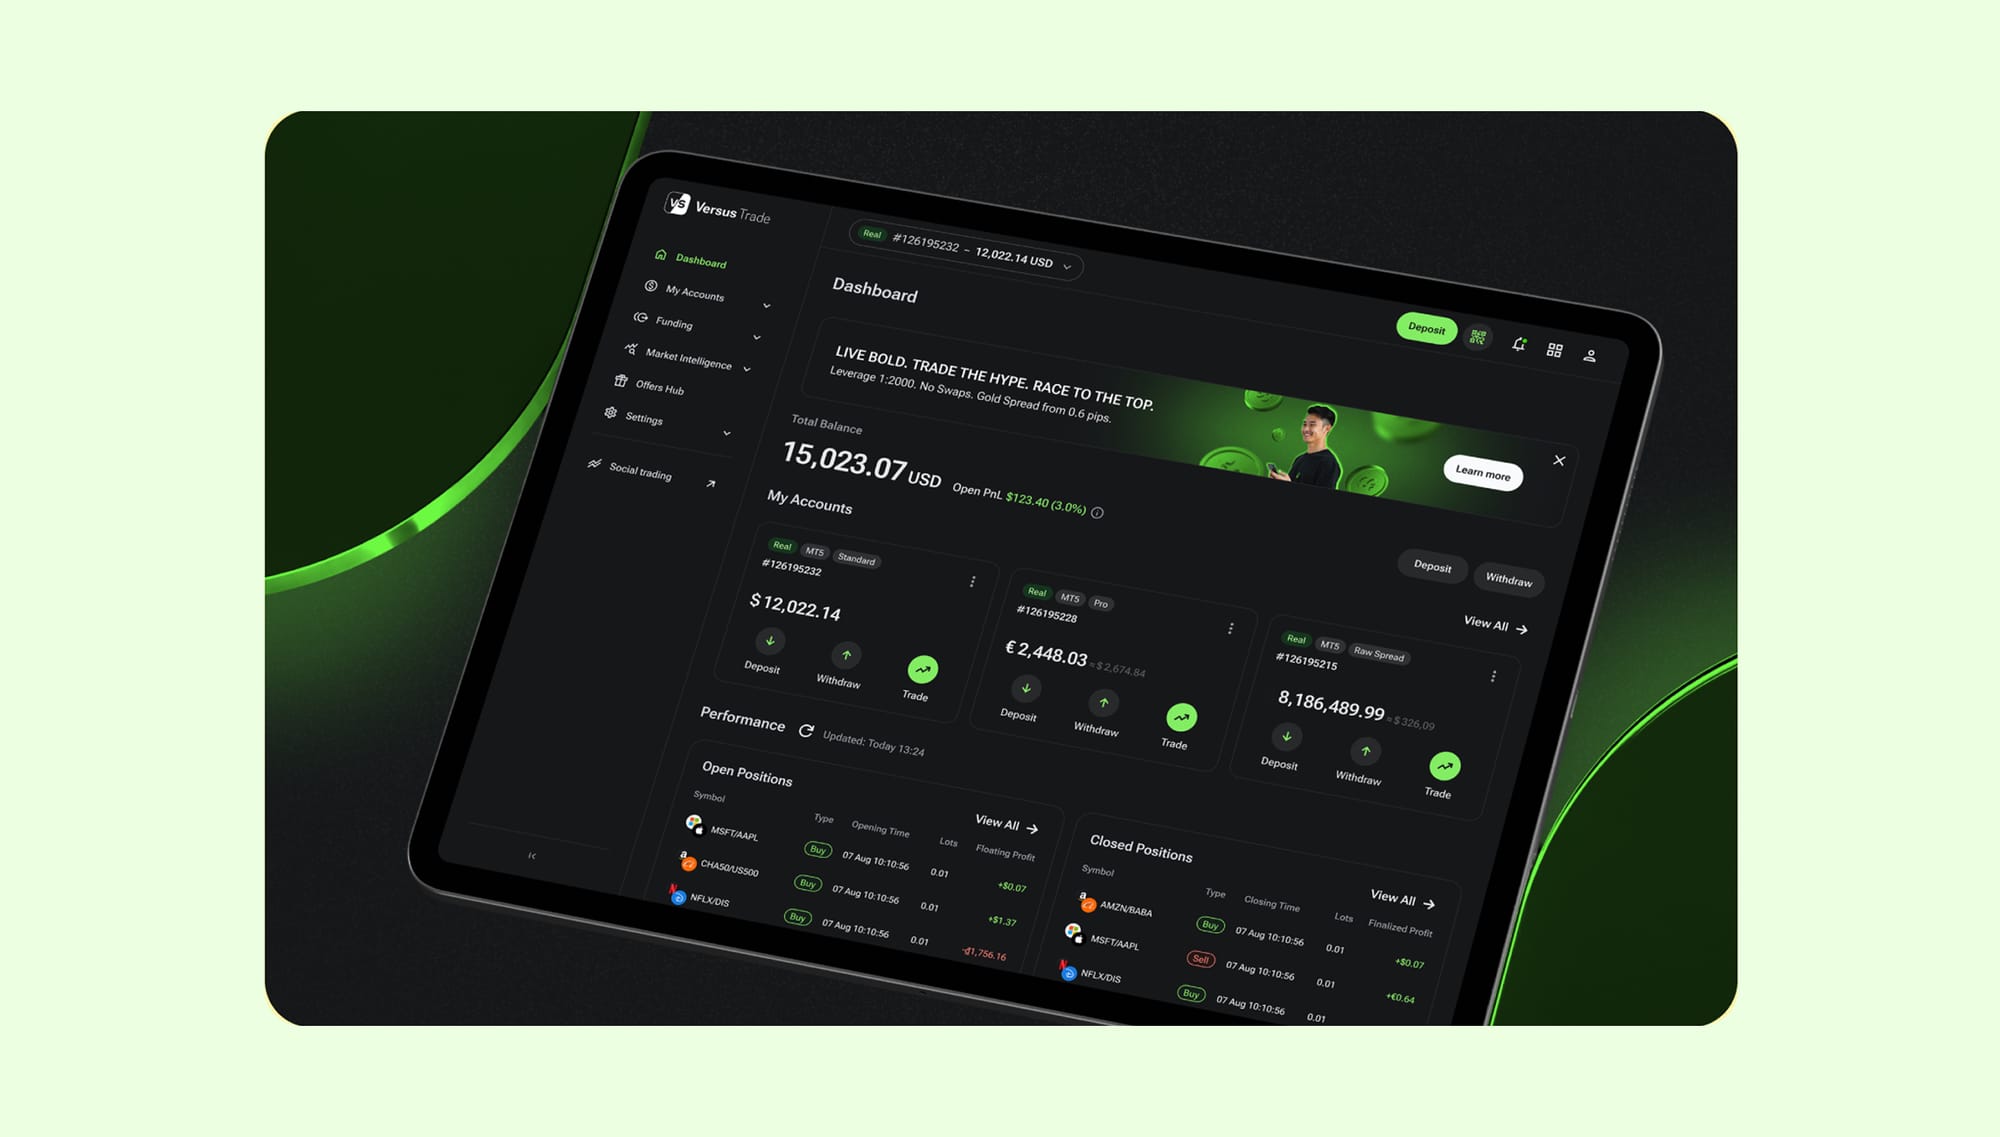
The work can extend well beyond a form. Our Versus Trade case study describes more than 3,000 responsive product screens across the client and partner areas, plus two marketing sites. It illustrates that exact structural work without establishing a form-conversion uplift. There's more in our article about fintech UX anti-trends.
Fix #3. Make your first screen answer three questions
Your homepage or app store listing has one job – to tell a stranger what this is, who it's for, and why they should care. If the answer is hard to find, a lost opportunity can look like an ordinary bounce in your analytics.
Cost, trust, and effort matter on this screen too. Show what the product does and what the next step asks of the visitor, with relevant proof close enough to help them decide. You'll need to test the message itself; the checkout figures above don't tell you how much a new headline will earn.
This can be a contained fix, though it may mean deleting some of your favorite and proudest sentences in the copy. Check whether target readers understand the offer, then measure qualified trial starts or demo requests per eligible visitor. More button clicks aren't much help if the wrong people are clicking.
Check out our teardown of SaaS product pages that convert if you want examples.
Fix #4. Fix speed before you fix anything visual
If the page struggles to load, give performance a place in the plan before adding heavier visuals. For example, Vodafone Italy's server-side A/B test reported a 31% improvement in Largest Contentful Paint, or LCP, alongside 8% more sales. To understand that result, keep the measure attached: LCP records when the largest visible content element renders, rather than when the entire page finishes loading, and the sales increase belongs to that particular test.
In T-Mobile's 2025 performance case study, the company reported a 42% reduction in Largest Contentful Paint and a 60% relative increase in conversion from visits with shopping intent to orders over the same period. The team improved caching, images, and its platform alongside other changes, so the case can't isolate the effect of speed alone. For your own product, it’s better to connect real-user loading data to the conversion you care about before deciding what to fix.
A large hero video, extra font files, or a bulky animation library can slow the page down. Check how it loads for real visitors, then test whether fixing those delays helps more people sign up, request a demo, or buy.
Fix #5. Design away your top five support tickets
Gartner gives median costs per contact of $1.84 for self-service and $13.50 for assisted channels. These aren't costs per resolved issue, and they don't turn every ticket your interface causes into a $13.50 tax. Use your own handling time and cost for the business case.
Here's how to start:
- Pull your last quarter of tickets.
- Group them by root cause, rather than just the customer's wording.
- Find the five screens or task failures generating the most avoidable contacts.
It could be a confusing screen a new user meets before they've added any data – an empty state or an error message that doesn't say what to do next. Fix the cause and watch repeat contacts as well as the number of tickets. Making support harder to reach can reduce tickets too. For fairly obvious reasons, that isn't the result you're after.
In Gartner's newest 2026 customer-service survey, 87% of respondents said companies using generative AI for customer service should keep a way to reach a human agent. Design away avoidable tickets while keeping that route open. You're trying to stop manufacturing tickets you didn't need.
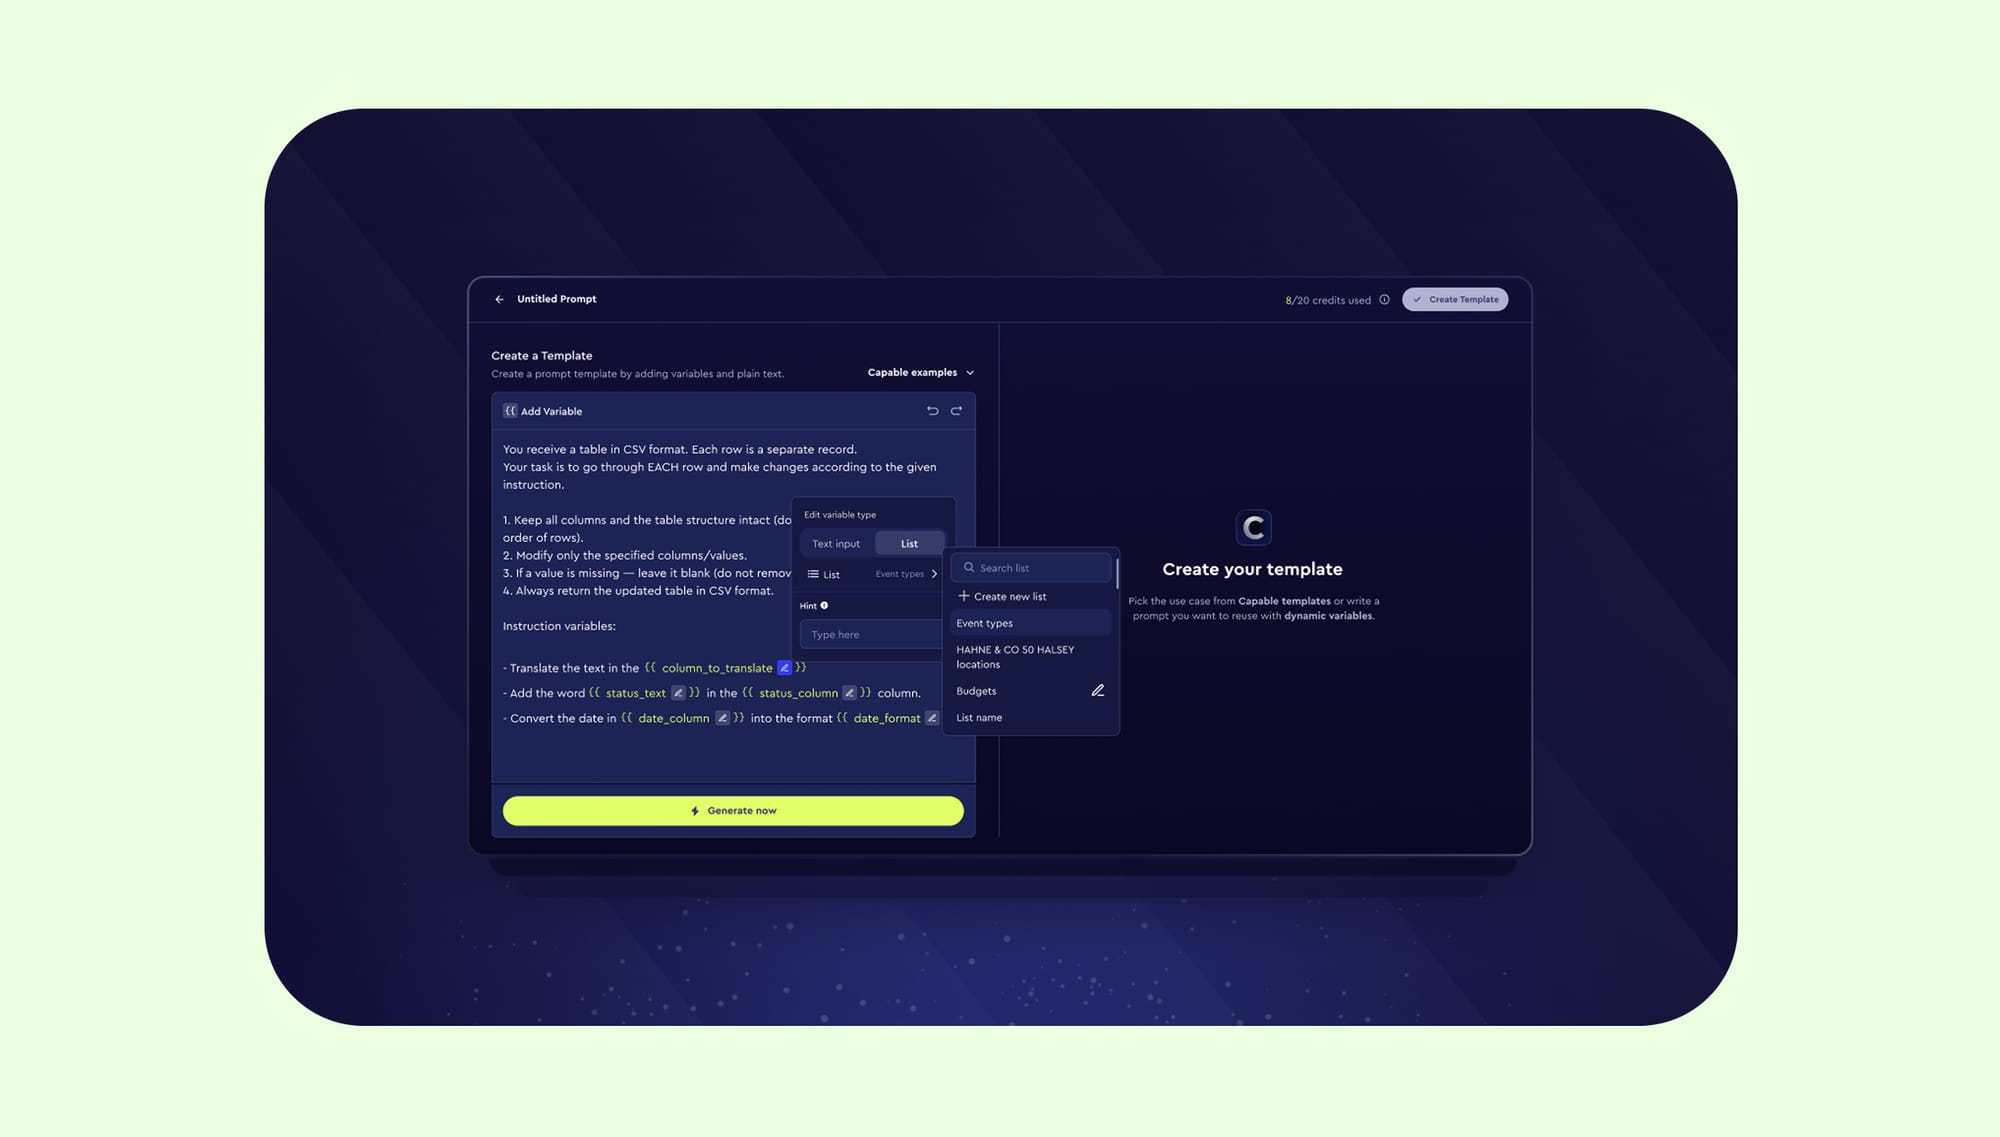
On Capable, a B2B AI platform, our work included research, simplifying navigation, and making the prompt builder easier to use. The public case study describes the work but doesn't report a measured change in retention.
Fix #6. Make the design carry the room when you're not in it
Your design does sales work where you don't see it yourself:
- When somebody forwards a screenshot to their VP.
- When a procurement lead opens your product next to two competitors.
- When a partner at a fund clicks your link mid-meeting.
People in those rooms may start with a quick judgment about whether the product looks credible and ready for their needs. A clear interface, a convincing product story, and visible evidence give them something useful to pass along.
That's the role design played for Test Ettir, an at-home health test startup in Turkey. Before there was a physical product, the brief called for a professional landing page to support investor pitches. We worked on the Shopify site, brand identity, and related visuals, and the client also returned for pitch-deck work. The case shows how design made the idea concrete; it doesn't establish a fundraising or revenue result.
How to judge it: track win rate on comparable competitive deals and how often “it looks unfinished” comes up in sales calls before and after. Watch for changes in pricing, lead quality, and the sales process; they can move the same number.
Fix #7. Build a design system once you're shipping fast enough to need one
A design system is a shared kit of pre-made parts that designers and engineers draw from rather than inventing them each time. Without one, every new screen reopens settled questions. What does a delete button look like? Which red means “error”? Someone redraws it, someone rebuilds it, and it lands slightly different from last time.
The business case starts with repeated work: how much time you spend designing, building, checking, and repairing the same patterns.
Figma's vendor study reported 34% faster completion of two design tasks when a suitable design system was available. Figma cautions that this is closer to a ceiling than a typical result. It's also a company selling the tools used for this work, so keep that context attached.
Sparkbox's study involved eight of its developers and one simple form page. The median build time was 4.2 hours from scratch and 2 hours with IBM's Carbon system. Developers did the scratch version first, so learning and task order may have affected the result. They're refreshingly upfront about the small scope.
To judge whether a system pays for your team, compare similar shipped tasks and include the time spent building, migrating to, and maintaining it. If reusable components free up capacity, you'll still need to show how that time becomes cash savings or additional shipped value.
How to tell whether the design work was effective
This is where a design engagement can get awkward. Before kickoff, agree on what should improve and how you’ll know:
- Measure before the work starts. Four to eight weeks of data may give you a useful baseline if they reflect normal usage. You may need a different period if traffic is low, demand is seasonal, or customers take longer to buy. If you can’t measure it now, you can’t confidently claim credit later, and neither can we.
- Pick one main metric for each fix. For onboarding, track the action that shows a user got value; for forms, track completion. “Overall vibes and revenue” won’t tell you which fix worked. Watch related numbers too, so more completed sign-ups don’t quietly come with more errors or support tickets.
- Release changes you can judge separately. If eight things are all 80% done, it’s hard to cut scope or tell what’s working. Separate changes where you can, and keep a record of anything else released at the same time.
- Give results enough time. Choose a period that fits how people use or renew your product, then give each group of users that full period before judging retention. Thirty to ninety days may suit some products, while annual renewals take longer. Let your product’s use cycle decide how long to wait, rather than borrowing a number from a blog.
To see whether the new version helped, measure the same thing for the same kind of users over the same length of time, and agree on those details before you launch. The table below will help you plan what to track and for how long, though you’ll still need to work out how many users you need for a reliable comparison.
Fix | Event | Baseline, cohort, and window | Primary metric | Guardrail | Costs to include | How to check |
First value | Accounts reaching the defined value event / eligible new accounts | Same role and plan; follow signup cohorts through the agreed activation window | Activation rate; time to value as supporting context | Later retention and support contacts | Research, flow design, integrations, build, tracking | A/B where feasible; otherwise inspect tasks and compare mature cohorts cautiously |
Forms | Successful submissions / eligible form starts | Same form and verification path; fixed completion window and comparable traffic | Completion rate | Qualified accounts, verification failures, fraud signals | Field logic, validation, design, engineering, QA | Controlled test with consistent assignment; task testing explains failures |
First screen | Qualified trial starts or demo requests / eligible landing visitors | Comparable channel and audience; allow lead qualification to finish | Qualified-action rate | Lead quality and downstream paid conversion | Positioning, copy, design, build, measurement | A/B if volume supports it; comprehension tests help diagnose the message |
Speed | Paid conversions / eligible visitors exposed to each version | Same device and traffic segment; fixed conversion window | Paid conversion rate; LCP as diagnostic | Errors, accessibility, conversion quality | Performance audit, engineering, assets, monitoring | Compare randomized versions where possible; inspect field performance |
Support | Contacts for the target issue / accounts exposed to that task | Comparable usage and issue mix; same contact and repeat-contact window | Avoidable contacts per exposed account | Resolution, repeat contacts, support access | Root-cause research, UI/help changes, build, support time | Track exposed accounts and issue categories; compare handling costs |
Sales confidence | Won competitive deals / closed comparable competitive opportunities | Same segment and sales stage; allow a full sales cycle | Competitive win rate | Discounting, deal size, lead mix | Design, content, sales enablement, implementation | Record exposure and objections; pre/post findings have sales confounders |
Design system | Total elapsed time from task start to acceptance / accepted comparable tasks | Same task complexity and definition of done; include QA and rework | Mean cycle time per accepted task | Defects, accessibility, adoption | Components, documentation, migration, maintenance | Compare task batches; account for learning and scope differences |
External benchmarks give you context. Your own baseline tells you what changed. For example, Userpilot uses anonymized customer dashboards, and its report doesn't state a calendar collection period. Its figures describe that sample and shouldn't be treated as universal targets.
What you're measuring | Published context or comparison to use | Source / scope |
B2B SaaS activation rate | 37.5% mean in the 2025 report | Userpilot; 62 B2B SaaS customer products |
Onboarding checklist completion | 19.2% mean, 10.1% median | Userpilot; separate sample of 188 products; checklist completion isn't activation |
Time to first value | Mean of 1 day, 12 hours, 23 minutes | Userpilot; 62 products; compare only with your own value definition |
Free trial to paid | Compare mature trial cohorts with the same plan, payment requirements, and eligibility | Your product analytics; a generic “good” range may combine different models |
Net revenue retention | Compare starting-customer revenue retained and expanded over the same period | Your billing cohorts; exclude revenue from new customers |
Three-month B2B retention | Define the returning event, eligible starting cohort, and usage frequency before comparing | Your product analytics; product activity, customer retention, and revenue retention answer different questions |
Features driving 80% of clicks | Median of 6.4% of features in Pendo's published sample | Pendo, July 2024; instrumented clicks, not feature value |
Take a look at that last row, though. A small set of features can account for most clicks. The remaining features can still account for the other 20%, play a smaller role, or do something important but infrequent. Before commissioning new screens, check usage alongside the job those screens support. We wrote more about how SaaS users actually adopt features.
You can still start small when you're looking for usability problems. For a typical qualitative test with one user group, NN/g's usability-testing guidance recommends five participants. Five. Fix what you find and test again because different roles or tasks may need separate groups. That recommendation doesn't tell you how many users a conversion experiment needs. Our user research guide for SaaS products covers the approach in more detail.
A hypothetical ROI calculation
Choose the period you want to evaluate. To calculate incremental contribution, subtract the variable costs of serving the extra business from the revenue it generates, then use that contribution in the formula:
ROI = (incremental contribution + realized savings − all intervention costs) / all intervention costs
Keep one-time costs—research, design, development, implementation, and measurement setup—separate from recurring maintenance, tooling, support, and monitoring. Both belong in the calculation for the relevant period.
Suppose, purely for illustration, that you have:
- 1,000 new eligible visitors each month.
- A paid-conversion improvement of 3 percentage points, such as 5% to 8%.
- $100 of incremental contribution per additional paid conversion, realized in that month.
- $9,000 in total one-time intervention costs and no additional recurring costs.
The monthly contribution increase would be 1,000 × 0.03 × $100 = $3,000. With a stable effect and a fresh eligible cohort each month, simple payback would be approximately three months. At that point, cumulative ROI is ($9,000 − $9,000) / $9,000 = 0%: you've recovered the cost. You haven't made a 100% return on top of it.
This is a model, not a Merge case, benchmark, or forecast. Add recurring costs or a fading effect and the payback changes. If the $100 is future lifetime contribution, you can't count the full amount again as new income every month.
For attribution, use a control or A/B test when the eligible volume and experiment design support it. Decide the metric, sample needs, assignment, and observation window before looking for a winner. Without a control, a before-and-after comparison can't isolate the specific effect of the fix: pricing, channels, seasonality, other releases, and changes in customer mix may explain some of the difference.
The same care applies when the metric you're tracking is activation, completed sign-ups, or faster design tasks. Those can be useful progress, but you'll need evidence of downstream paid behavior before giving them a revenue value. Fewer support hours free up capacity; count a financial benefit only when you can show lower cash costs or value from putting that capacity to work elsewhere. Count each benefit once, even if it improves several dashboard metrics.
What UI/UX design services cost in 2026
As of November 2026, Clutch's UX pricing guide reports an average reviewed project cost of about $84,973, a typical duration of ten months, and an average monthly figure of about $8,895. These are platform aggregates, so don't expect them to match a single project's invoice.
The guide places typical projects in the $10,000-$49,999 range. Its country table lists hourly rates of $100-$149 in the US, Canada, and Australia; $50-$99 in the UK, Poland, and Spain; and $25-$49 in Ukraine, India, and Mexico. These are Clutch's market figures, rather than Merge quotes or a price for your particular scope.
For a usable estimate, compare what each engagement has to cover:
Engagement | What determines the quote | Best for | Watch out for |
UX audit: one flow | Roles, states, analytics access, expert review, and whether user testing is included | Knowing what's broken before you spend | An audit that ends in a slide deck and no priorities |
UX audit: full product | Number of flows, permissions, platforms, research coverage, and depth of analysis | Pre-redesign diagnosis | Findings you can't sequence or cost |
Discovery sprint | Research questions, recruitment, interviews, analysis, and decision workshops | Unclear problem, clear urgency | Research that never converts into decisions |
Design sprint | Preparation, decision-maker availability, prototype scope, and testing | One big bet that needs checking | Sprints used to avoid picking a direction |
MVP design | Core flows, responsive views, states, integrations, and developer handoff | Zero to launchable | Scope drift into “while we're in here” |
Monthly retainer | Reserved capacity, seniority, workstreams, review time, and rollover terms | Continuous product work | Being the smallest client on the roster |
Full product redesign | Role coverage, migration, dependencies, implementation, QA, and staged releases | Structural rebuild | Everything 80% done, nothing shipped |
Use those scope details to ask for a quote and delivery plan before choosing a budget. Separate the design fee from recruitment, development, analytics, and ongoing work so you can see the full investment.
If you're comparing that quote with an in-house hire, include salary, benefits, recruiting, tooling, management time, and coverage when someone is away. Also consider the capacity and continuity you need. An agency and an employee aren't interchangeable line items simply because both can produce the designs.
When you shouldn't hire a design agency at all
We'd rather you hold off hiring a design agency if:
- You haven't found product-market fit and want a broad visual redesign to fix it. Design can make a wrong product easier to reject. It can't make people want it. Focus the next spend on learning whether the problem and positioning are right; a small research or prototype scope may still help.
- You have a small audience and expect a precise uplift experiment. Low traffic can make that result slow or uncertain. You can still watch people attempt the core task, interview them, and fix observed failures.
- Your internal tool already supports its tasks well enough. Training may be the better spend for a local knowledge gap. Familiar users can still lose time, make costly errors, or encounter accessibility barriers, so check those before deciding design isn't needed.
- Your real problem is engineering throughput. A prettier Figma file does not make an overloaded backlog move faster. Check whether clearer components or handoff would help the actual bottleneck before adding more design work.
- Nobody on your side can make decisions. Agencies don't fix an approval process. They get eaten by one.
Sonos is a useful warning about execution. Following its 2024 app redesign, the company's 2024 annual filing said it expected short-term costs of up to $30 million to improve the app experience and address customer and partner concerns, including additional support. That was an expected recovery cost, rather than a confirmed final redesign bill. Before funding a rebuild, make sure you can implement, test, release, and support it.
How to pick a UX/UI design partner
For that, we would recommend asking the following questions:
- What's your median retainer? Use the answer to ask how your budget fits their staffing model. If you're much smaller than their usual client, find out who is reserved for your work and what happens when another account needs more hours.
- Can I have access to time tracking or an equivalent delivery record? For hourly work, agree how you'll see time spent, scope changes, and remaining budget. For fixed fees, ask for milestones and acceptance criteria. Find out that a task has ballooned before you've paid for it.
- How many workstreams will be open at once? Agree on a small number your team can review and ship. If eight things are all 80% finished, you can't cut scope, and you can't walk away without losing the lot.
- What percentage of billables is project management? Then ask what happens to it at your budget and what coordination it covers.
- Who's doing the work, and will they be in the room? If your design questions have to go through a project manager to reach a designer, you're paying by the hour for a game of telephone.
- Can you show me an outcome, not just a screenshot? A portfolio full of pretty screens tells you what an agency can draw. Ask what changed, what was measured, over what period, and what else changed at the same time. For an early product, a tested decision can be a reasonable outcome; don't demand an invented revenue figure.
There's more in our nine questions to ask before hiring a B2B web design agency, plus a comparison of the field in our roundup of product design agencies for SaaS and fintech. If you're choosing a team for a startup engagement, the startup UI/UX agency buyer's guide takes that decision further.
What AI changed, and what it didn't
You've probably wondered whether you still need UI/UX design services when an AI tool can generate a convincing interface from a prompt. Fair question.
Tools such as Lovable and Figma Make give teams another way to explore interfaces. What you get still depends on the task and the input; a convincing prototype needs checking before anyone treats it as a finished product.
Nielsen Norman Group's study of AI prototyping in real design contexts found that more detailed design references helped tools translate the design more accurately. Its verdict was “good from afar, but far from good.” The useful irony remains: if you've already worked out the structure and interaction in a detailed reference, you've done a good part of the design thinking yourself.
NN/g takes that even further in State of UX 2026, saying that, as interface production becomes easier, teams need deeper judgment about what to build. Of course, that's only the authors' assessment, rather than a settled prediction about every design job.
In Figma's 2026 AI report, 90% of respondents said design was at least as important as before AI, and nearly six in ten said it was more important. That's how respondents see design's role. The goals teams set are worth looking at too. In Figma's 2025 survey of 2,500 Figma users, only 9% of AI builders named revenue growth as the top goal, while 76% cited broader aims such as experimenting with AI or improving customer experience. Those goal figures come from the older survey, but they still raise a handy question: what result is your AI project supposed to produce, and how will you know?
So, yeah, producing an interface got easier. You still spend a lot of time figuring out which one is worth building.
Wrap-up
Before approving a visual refresh, check the less glamorous work too: the steps to first value, unclear forms, slow pages, and the screens quietly generating support tickets. Fund the visual work when the problem and evidence support it.
Whichever fix you choose, give it a primary metric, include its full cost, and follow the result far enough to know whether it created contribution, cash savings, or useful capacity. Baseline your numbers before anyone starts, and ship in pieces you can evaluate. If you're hiring an agency to do the work, ask who it can assign within your budget.
Your next step depends on how much you already know:
- The cause is still unclear: read what a UX audit can help you investigate before committing to a redesign.
- The product flows are defined, and you need design work: see Merge's UI/UX design services for defined product flows and discuss the deliverables your scope needs.
- You're comparing external teams: use the startup UI/UX agency buyer's guide to prepare your shortlist and questions.
FAQ
What's the difference between UI design and UX design?
UX decides what happens and in what order—the flows, structure, and steps. UI decides what it looks like and how it responds. You can have a beautiful UI on a flow that loses people before they get value. Check where the task breaks down before deciding which kind of work to fund.
How much do UI/UX design services cost?
Clutch's recent pricing guide reports an average reviewed project cost of about $84,973 and typical projects in the 10,000–49,999 range. Those figures cover different scopes and aren't a Merge quote. For your estimate, define the flows, roles, states, research, testing, and handoff, then include implementation and measurement costs separately where needed.
How long does a UI/UX design project take?
A single-flow audit, an onboarding redesign, and a full product redesign need different plans. The number of roles and states, access to users and analytics, decision speed, and development dependencies all affect the schedule. Ask for milestones that separate diagnosis, design, implementation, and time to observe the result. If someone quotes a full rebrand plus redesign in one neat block, ask what happens when the scope changes.
Should I hire an agency, a freelancer, or an in-house designer?
A freelancer may suit defined, contained work when you can manage the surrounding decisions and handoff. If you need several disciplines and a coordinated delivery plan, consider an agency and confirm which disciplines are actually included. In-house makes sense when design needs continuous product context and a seat at the roadmap table. Compare total cost, continuity, and the management time you can provide.
Do UI/UX design and development services from one team actually help?
They can, mainly through handoff. When designers and developers work closely, they can resolve questions about behavior, states, and responsive layouts earlier. One company name doesn't guarantee that coordination, though. Ask who implements the work, who checks it, and whether front-end development is part of the proposal or a separate scope.
How do I know if the design work paid off?
Before kickoff, record a baseline for the metric tied to your fix and agree on the comparison method and observation window. When you assess the result, connect the change to incremental contribution or realized savings and subtract all intervention costs. A control helps establish attribution; without one, acknowledge other changes that could explain the result. Activation or freed support time can be useful progress without yet proving a financial return.
Is a UX audit worth it before a redesign?
It can be worthwhile when the cause of a problem is unclear, or you need to prioritize competing fixes. You may discover that a few targeted changes make more sense than a rebuild. Agree on the questions, evidence, priorities, and next decisions the audit should produce. Our UX audit guide explains the approach – the right scope depends on what you already know.